Serving riders calls for data that provides meaningful insights into your community, both today and in the future. Knowing which routes people are taking, how they are paying, how many transfers are required per trip, and how demographics shift over time are paramount to optimizing service and restoring ridership.
You need to meet people where they are and support the ones who need a (literal and figurative) lift. But you can’t do that with just a few high-level stale data points.
Genfare has re-engineered our Genfare Link reporting platform to provide meaningful and actionable data in an easy to use and accessible interface.
Data that supports equitable mobility
Accurate and detailed reporting helps you stay on top of changing neighborhood demographics and transit use trends — factors like preferred fare media, bus line activity, and what types of customers are riding–or not riding–the bus. It tracks performance and reveals opportunities to improve route timetables, offer the right vehicle service options, or even collaborate with the community for events.
Reporting isn’t just about keeping your current customers happy; it’s also a tool for uncovering equitable ways to extend your service to people who need it the most.
Not all reporting tools are created equal
Putting together a complete picture of the state of your service often means manually transferring data from your buses, pulling large, messy datasets from multiple sources, and consolidating them into a clean report. By then, the data isn’t “fresh,” which impacts your ability to make agile, data-driven decisions. This time-consuming task doesn’t work for modern agencies that want to be proactive about capitalizing on opportunities and reducing risk.
We re-engineered and redesigned the Genfare Link reporting platform to address these pain points so that your agency can:
- Streamline operations: Genfare Link centralizes all customer and fleet data into a single source of truth. When leveraging cloud-based hardware, agencies have one location for all configuration and reporting. Genfare Link has updated device management to see all asset status, configure and upgrade hardware remotely, and consolidate all reporting across the agency.
- Scale your business: We use open architecture and partner with AWS to give you greater flexibility and compatibility for all your third-party apps, software, and smart hardware.
- Anticipate your customers’ needs: Our reporting dives deep into rider travel and payment behaviors, so you can make well-informed optimizations that boost ridership and customer satisfaction.
- Better data transfer: Wi-Fi and cellular probing allows all Fast Fare farebox data to be transferred to the cloud as soon as the farebox has connectivity. This minimizes IR probing time or eliminates it with a smart card access option. Agencies can use cellular or Wi-Fi data probes to get accurate, real-time reporting, automatic software updates, and farebox upgrades that save time and reduce maintenance costs.
- Open API: Agencies can import data from any third party into the Genfare Link system or export data into an alternate system. The product was engineered to allow agencies to choose how to best service their riders and stakeholders.
Genfare Link simplifies the way you access and pull reports, adding intuitive navigation and customization without sacrificing data quality. Follow these quick steps to get started with Genfare Link reports.
How to create a ridership report using Genfare Link
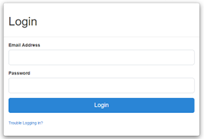
Step 1
Log on to your agency’s instance of Genfare Link with your credentials.
Step 2
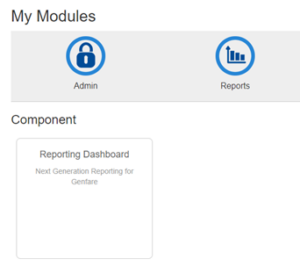
Click Reports → Reporting Dashboard.
Step 3
Click Ridership to view and customize the dashboard.
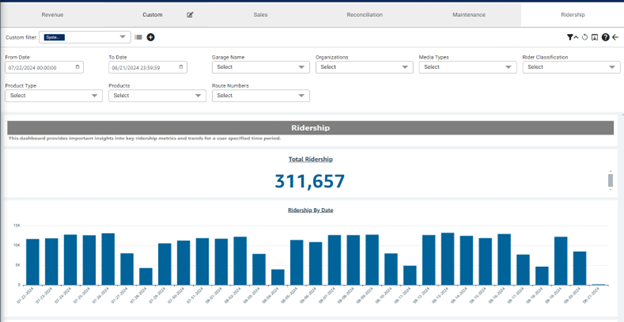
Note: Genfare Link will dynamically show you only the reporting modules that are relevant to your role and function, keeping things clear and easy to navigate.
Step 4
Start by selecting your filters. In the upper right corner, click the filter icon to show or hide the filter options. You can add as many filter options as you need. These can include:
- From Date and To Date and time
- Route numbers
- Organizations your agency supports
- Rider classification (e.g. full fare, half fare, veteran, retired employee)
- Media types
- Product types (e.g. period pass or stored value on smart card)
- Your agency’s specific product names
- Garage names
You can remove your filter selections at any time by going back into the filter and re-clicking on the options you want to remove your report.
Step 5
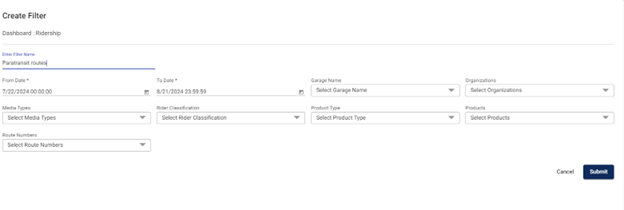
Custom filter for information that is used often. Each user can add or delete as many custom filters as needed to quickly and easily parse the data used most.
Custom Filters: If you’d like to save your filter settings, click the “plus sign” icon. Enter a name for your filter as well as what garage, organization, media, riders, product, or route number to filter by. Then click the Submit button to save. Your custom filter will be stored in the Saved Filters list for future use.
Step 6
To download your report as a .csv/Excel file, save to PDF, or print, click the download button that appears like a downward pointing arrow. Each data set can be downloaded as a .csv file by hovering over the data and clicking the three dots on the top right of the data set.
Graphs and charts for visual insights
Genfare Link now incorporates charts, maps, and graphs in the dashboard to help you quickly visualize your data. For example:
This ridership-by-date bar chart shows the number of riders for each day of the month over the last 30 days:

While pie charts give you a snapshot of the popularity of your product or media types (for example):
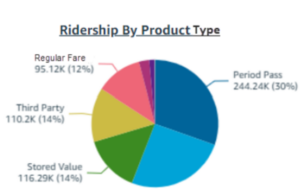
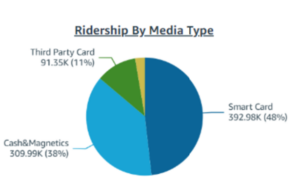
To know when riders are active, there is an Hourly Ridership Trend. Are riders going back and forth to work? Shopping? Entertainment? School? This high-level graphic can result in interesting insights into who is riding and why.

If your agency tracks bus locations, Genfare Link will display ridership by stop along your bus routes on a map, with a dot representing each stop. This is another reporting option that can inform how you direct operational resources for the greatest impact.

To get a closer look look at how individual lines or stops perform, you can zoom in by bus stop, route, or day. The below map shows ridership over the last 30 days at the River and Front Streets stop:
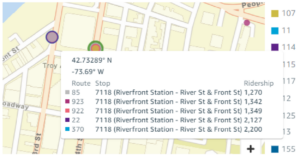
This is what the same stop looks like on a single day:
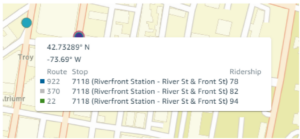
The above steps are just a few staple functions of the Genfare Link reporting dashboard. These features are also available throughout the suite of reporting dashboards, from reconciling revenue to checking hardware for maintenance.
No customer left behind
To be a reputable transit agency, it’s imperative to provide service that customers can depend on, whether that’s getting them to their interviews, doctor’s appointments, or daycare pick-ups. But to be a leader in the transit industry, the next step is to modernize your reporting to build an agency that is successful and equitable and allows for data-driven decision making.
We’re excited about what the cloud can do to future-proof your transit solutions. Contact our Business Development Directors to learn how Genfare Link can support your revenue and ridership goals.
